NS = Not Sampled
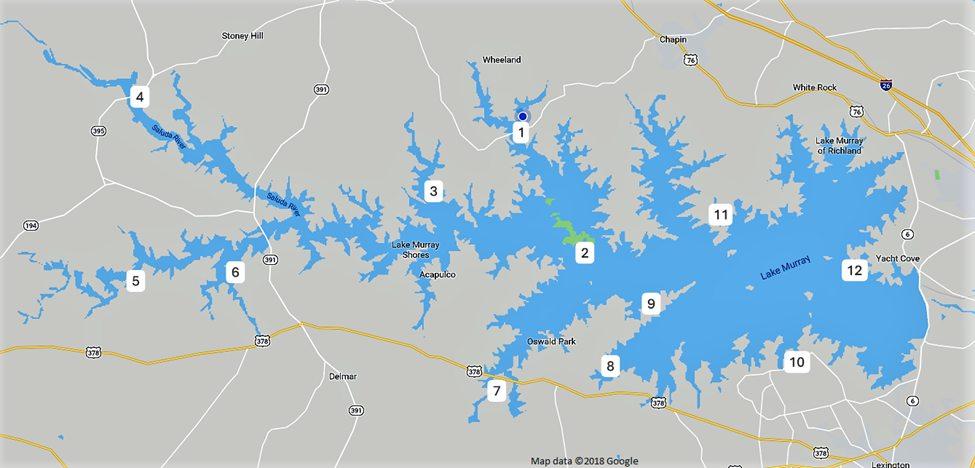
Here are the results of our water sampling from March 2025 to March 2026. This year we have added 4 new sites, Adam’s Camp Bridge, Martin’s Landing, Hilton Recreation Area, and Pine Island. The addition of these sites will provide better coverage of the whole lake. The Pine Island site is replacing the Hollywood Road site of the past. Last year the March E. Coli levels at some sites were elevated and then were low for the rest of the year. This year they remained low except for two of the new sites, Adams Camp Bridge and Pine Island. The phosphorus levels showed an increase during the warmer summer months of last year and by November were again in the low range. This year so far all of the sites showed low levels of phosphorus except for the Little River Landing site which has been showing troubling levels of phosphorus. Several factors may have contributed to these spikes, including increased agricultural runoff, heavy summer stormwater flows, and algal blooms fueled by warmer temperatures. Other likely contributors are lawn fertilization and failing septic systems. Both of these can result in excess phosphorus washing into nearby streams and Lake Murray. We will be paying attention to future sampling results to determine if these elevated levels persist and to better understand any seasonal or environmental patterns contributing to these changes.